Wednesday, July 14, 2010

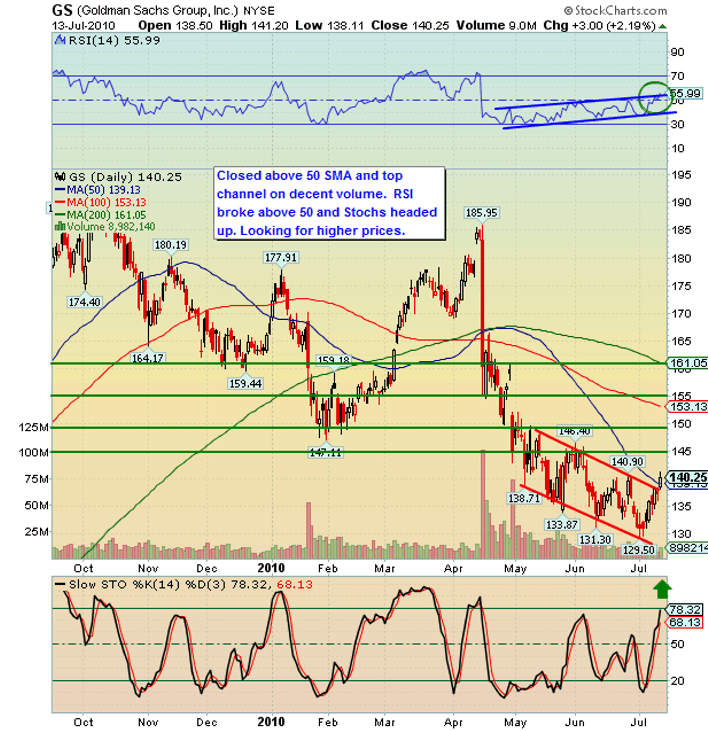
GS "Goldmans Sack" - Looking good!

Goldman's Sack (As I like to call it) broke above the descending trend line (top channel) and above the 50SMA.  RSI just peaked above 50 which I also consider bullish.  The market has been picking up lately and tomorrow is a crucial day for the SPX as it closed right at the 50SMA.  If Goldman takes the role of a market leader after all the bad news surronding the stock lately, the market is definitely going higher!  GS has room to run, if there is continuation, 1st Target 145 (approx), 2nd Target 149.50!

GS Daily Chart:


SPX Daily Chart - hitting right into the 50 SMA

Tuesday, July 13, 2010

STEC - Short did not confirm

Was watching STEC today for a short but the market did not let it retrace.  STEC went right up with the rest of the market and at no point did it confirm to sell short.  A confirmation to sell short for me would have been a breach below the prior days low, but it never did.  STEC currently closed right at the 200 SMA and I will watch closely tomorrow to confirm if it acts as resistance once again.  If the Market is strong and it breaches the 200 SMA on vol, I will now discard it as a possible short opportunity.

Here is the daily chart:


Thanks for reading!

STEC - Another short on watchlist

Today STEC hit right into the 200SMA and retraced on higher than average volume. This stock could retrace back to the 100 and 50 SMA's which should provide some support around 13.20.  Could get a buck ($1) out this short! On Watchlist!


IDT - Short Candidate - 07-13-10

I have been watching this one go up and up and up! Volume should be drying up soon as it is overbought and will be a good short candidate.  Will keep on watchlist for possible short tomorrow or Wednesday.

YRCW end of day check

YRCW continued its move up nicely. I sold early but if I would have placed a 2 cent stop, I would have been stopped out.  I took the 20% and ran!  I am going to keep a close eye on it tomorrow as it could run into the 100MA (.30 - .31) if the momentum continues.  Keep an eye on it!

Monday, July 12, 2010

APC breakout to continue?!?!?!

APC has had a big move from its bottom and is approaching its 50SMA and gap resistance.  If APC can break through this area, It can easily run to the 51's.  In addition, news on the BP oil spill cap will probably give it an extra push.  Might look to trades some calls on it tomorrow.

Is the bottom in for YRCW?

Picked up 10,000 shares today at .1575 for a short term trade.  YRCW released guidance today which was above analyst estimates.  Price currently breaking descending trend line.

YRCW Daily Chart